Week 5: Update HTML Reports Triage based on Multiple Intermediate Reports
What did you do this week?
I am done with improving the HTML Reports when output is generated using intermediate reports.
I have added 4 Ploltly based graphs in the report. Including a severity trace for different severity types i.e. (High, Low, Medium, Critical, Unknown)
 You can check an example here
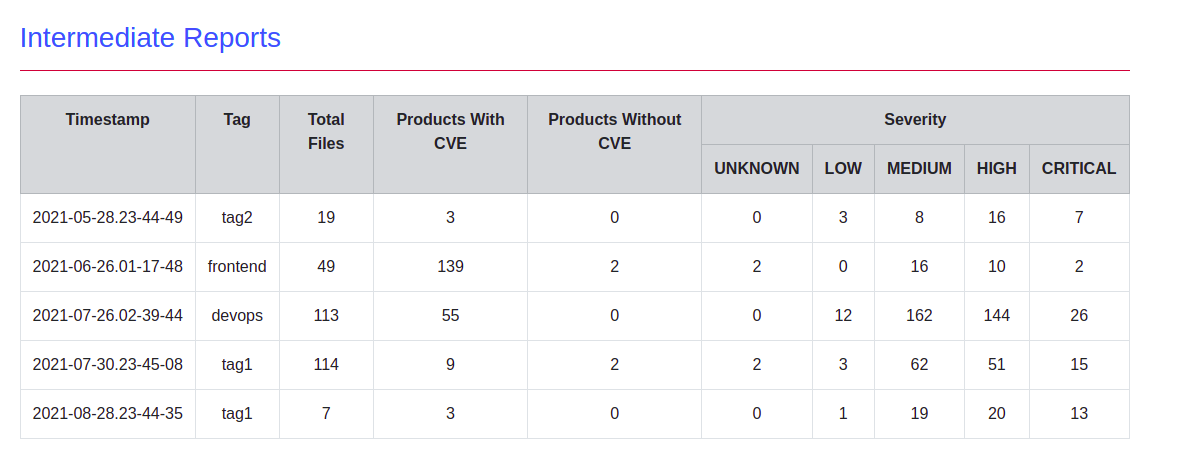
I have also updated the print_mode in the same reports with a new intermediate based table showing some necessary metadata which will be useful while comparing the triage trends.
You can check an example here
I have also updated the print_mode in the same reports with a new intermediate based table showing some necessary metadata which will be useful while comparing the triage trends.
What is coming up next?
I am going to add a similar table representation in the PDF reports. And then I will start working on updating the documentation and some html report related tests.
Did you get stuck anywhere?
No
I am done with improving the HTML Reports when output is generated using intermediate reports.
I have added 4 Ploltly based graphs in the report. Including a severity trace for different severity types i.e. (High, Low, Medium, Critical, Unknown)
You can check an example here
I have also updated the print_mode in the same reports with a new intermediate based table showing some necessary metadata which will be useful while comparing the triage trends.
What is coming up next?
I am going to add a similar table representation in the PDF reports. And then I will start working on updating the documentation and some html report related tests.
Did you get stuck anywhere?
No